Singapore Insurance Strategy Dashboard



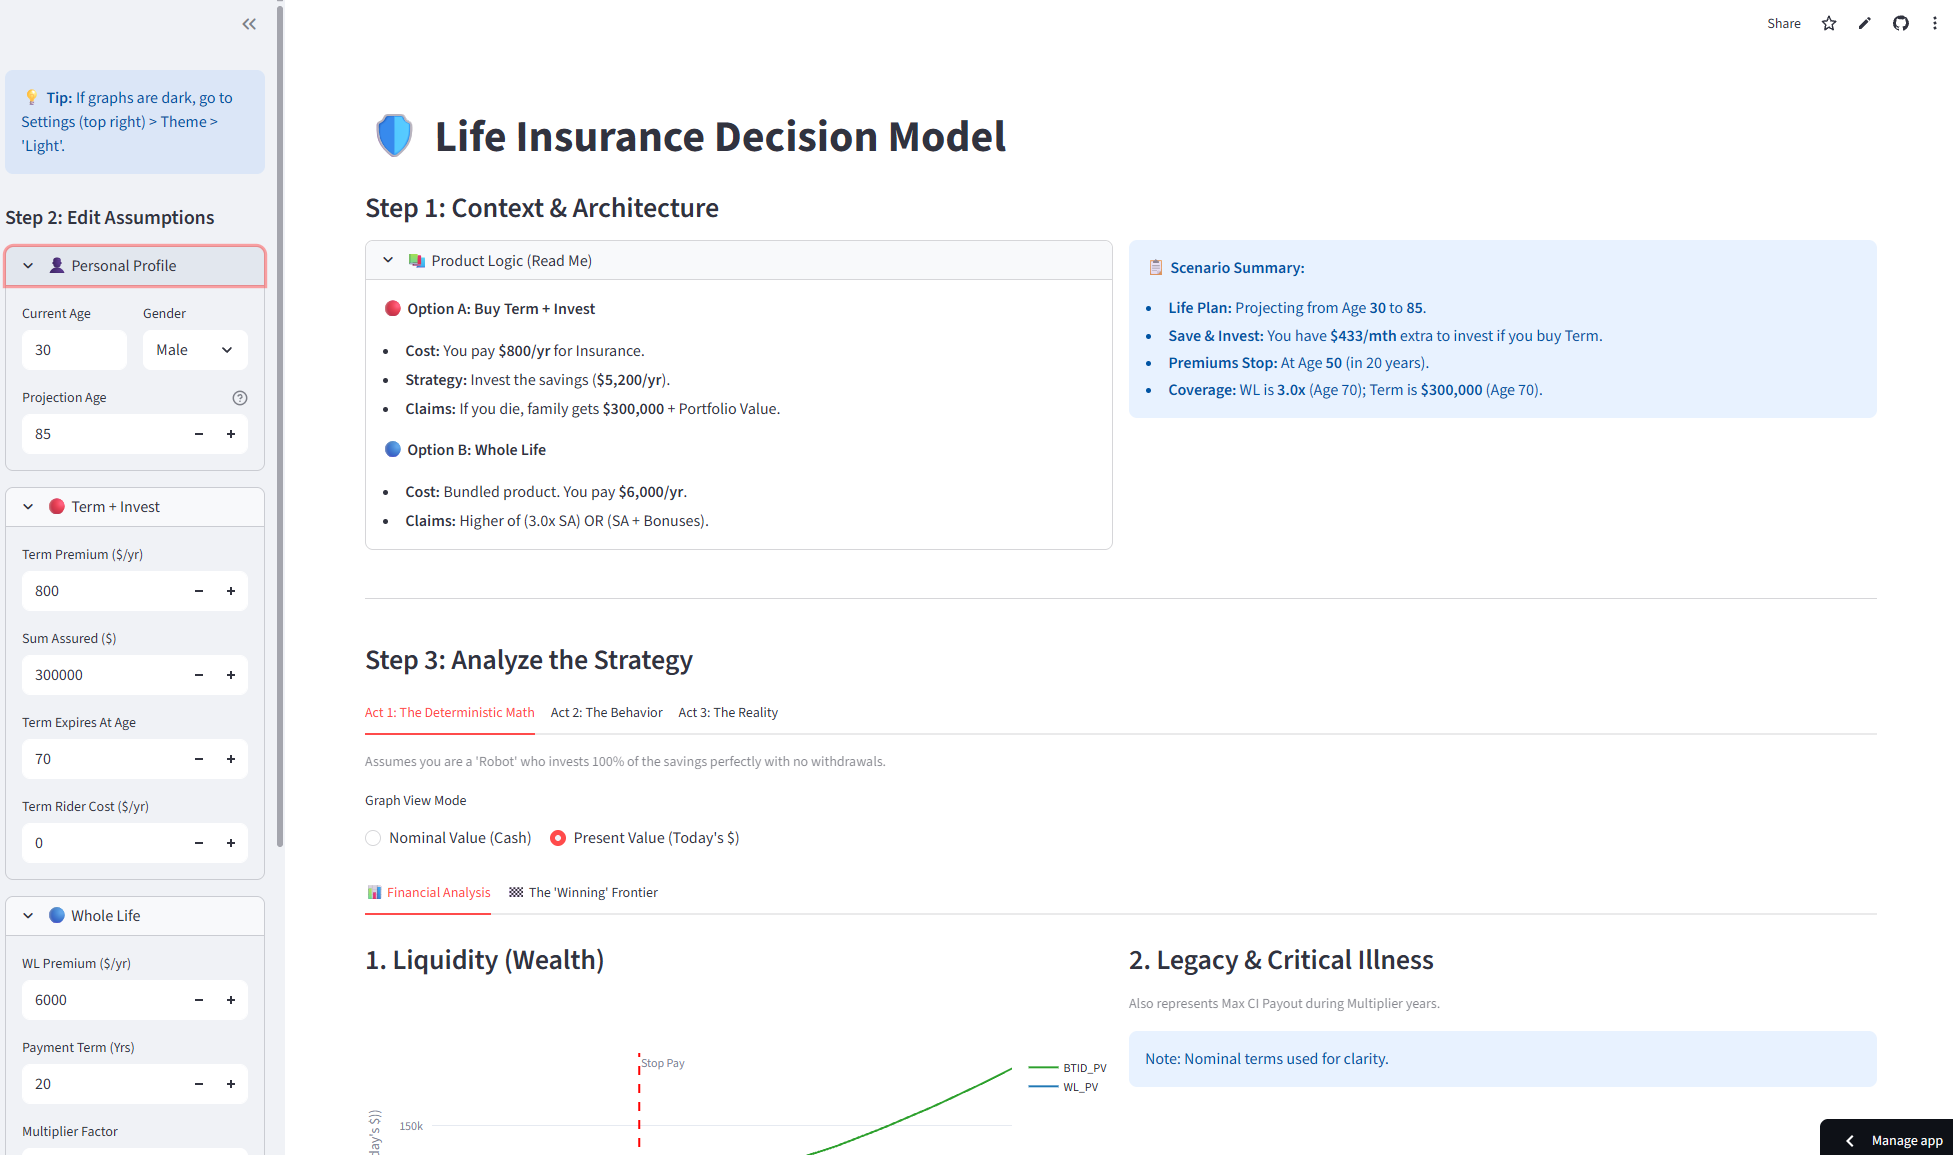
The Problem: Math vs. Reality
In the Singaporean personal finance community, the debate between buying a Whole Life (WL) policy versus “Buying Term and Investing the Difference” (BTID) is endless.
Most calculators are purely deterministic: they assume you invest the difference perfectly every month for 40 years. But humans aren’t robots.
I built the Singapore Insurance Model to answer a deeper question: “At what level of human error does the ‘mathematically superior’ strategy fail?”
The Data: Incorporating Actuarial Science
A key differentiator of this project is the move away from “average life expectancy” to rigorous actuarial data.
1. The Source: S0408 Tables
Instead of using generic global mortality rates, I integrated the S0408 Singapore Mortality Tables. These tables serve as the industry benchmark for insure-tech in Singapore, providing the specific \(q_x\) (probability of death at age \(x\)) for the local demographic.
2. The Thought Process: Static vs. Probabilistic
The initial version of the dashboard (Act 1) treated death as a fixed event at age 85. However, this ignores the primary value proposition of insurance: tail risk.
To model this accurately, I had to transform the discrete annual data from the S0408 tables into monthly probabilities. This allowed the model to run simulations where “Death” or “Total Permanent Disability” (TPD) could occur at any month \(t\), triggering the sum assured payout immediately rather than at the end of the horizon.
Technical Challenge: A major hurdle was handling the “Multi-Claim” logic. In Singaporean policies, a Critical Illness (CI) claim often accelerates the Death Benefit. I had to write logic to ensure that if a CI event occurred in the simulation, the remaining Death Sum Assured was reduced proportionally, reflecting the “multiplier” effect found in real-world Whole Life policies.
The Solution: A Three-Act Structure
I designed the application in three distinct layers of complexity, which I call “The Three Acts.”
Act 1: The Deterministic Baseline
The first layer builds the standard financial projection.
- Liquidity Analysis: Comparing the Surrender Value of WL against the liquid portfolio of BTID.
- Legacy Visualization: Tracking the Death Benefit sum assured over time.
- The ‘Strategy Frontier’: A dynamic calculation that pinpoints the exact age where BTID overtakes WL based on user-defined investment returns (e.g., 4% vs 7%).
Act 2: Behavioral Stress Testing
Data shows that most retail investors do not reinvest their savings perfectly. I introduced a “Discipline Coefficient”, a slider allowing users to see what happens if they only invest 50%, 70%, or 90% of their premium savings.
Key Insight: Through this feature, I discovered that if an investor’s discipline drops below ~60%, Whole Life plans often outperform BTID due to their “forced savings” nature, despite lower internal rates of return.
Act 3: Stochastic Reality (Monte Carlo)
Life isn’t linear. Using Monte Carlo simulations, I modeled:
- Actuarial Risk: Probabilities of Death and Total Permanent Disability (TPD) using Singapore’s S0408 tables.
- Sequence of Returns Risk: Instead of a flat 7% return, the model simulates market volatility to show the range of possible outcomes for the BTID portfolio.
Technical Implementation
The application is built entirely in Python and hosted on Streamlit Cloud.
Key Technologies
- Streamlit: For the reactive frontend and state management.
- Pandas/NumPy: For vectorizing the cashflow projections over 50+ year horizons.
- Plotly: For interactive financial charts that allow users to zoom into specific life stages.
Code Highlight: The Discipline Logic
One of the most challenging aspects was modeling the “leakage” of capital when discipline wavers.
# Pseudocode logic for the discipline stress test used in the app
def calculate_btid_accumulation(savings, discipline_rate, market_return):
    # discipline_rate is a float between 0.0 and 1.0 (e.g., 0.8 for 80% discipline)
    realized_investment = savings * discipline_rate
    leakage = savings * (1 - discipline_rate) # Money spent on lifestyle, lost forever

    # Projecting the portfolio with the 'leaked' capital removed
    # This reveals the true cost of human behavior on compound interest
    portfolio_value = npf.fv(rate=market_return/12, nper=months, pmt=-realized_investment, pv=0)
    return portfolio_value
Conclusion
This project started as a calculator but evolved into a behavioral finance tool. By allowing users to toggle their “Discipline,” the dashboard moves beyond telling people what they should do, and helps them visualize what they are likely to achieve based on their own habits.